It All Looks So Different This Time

December 8, 2022 - 5 minutes
Two business people looking over a report.

The Sweet Spot: Bloated Balance Sheet with Expanding Margins

Pandemic Quantitative Easing (QE) starting in 2020 was different from QE following the 2008 economic downturn in that it led to bank balance sheets that are far larger in size today than they would have been otherwise. Just as QE inflated deposit balances, we expect Quantitative Tightening (QT) to lead to surge deposit run-off. This is already playing out in the U.S. where weekly data from the Fed provides for timely analysis.

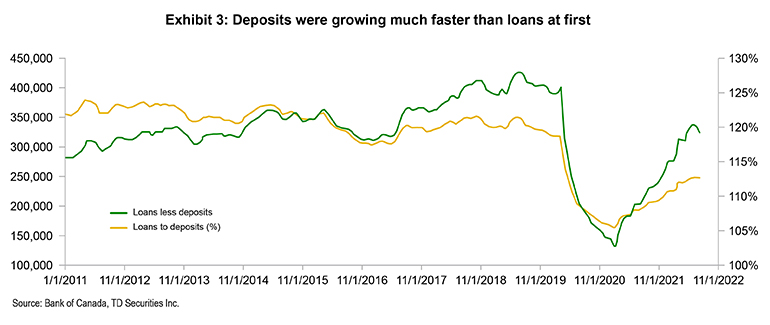
The group's Liquidity Coverage Ratio (LCR; the proportion of highly liquid assets) expanded abruptly early in the pandemic as QE drove deposits higher, but loan growth did not keep pace. Now we see LCRs trending lower, as deposit growth slows (even starts to run-off) and loan growth accelerates.

The vast increase in the Bank of Canada's balance sheet

From the start of the pandemic, the Bank of Canada (BofC) balance sheet (assets or liabilities plus capital) increased by 469% in the first year of the pandemic. The decline that followed the peak mostly related to repurchase agreement (REPO) holdings which declined sharply after financial markets started to stabilize in the summer of 2020. The initial spike in REPO assets is similar to what we saw in 2008 and reflects the BofC offering short-term funding to the commercial banks.
Line graph of Bank of Canada Balance Sheet where Bank of Canada Assets and Liabilities jumped significantly in 2020
The exhibit above also demonstrates that quantitative tightening (QT; the decline in bond holdings) has only just started (bond holdings are down $50 billion).

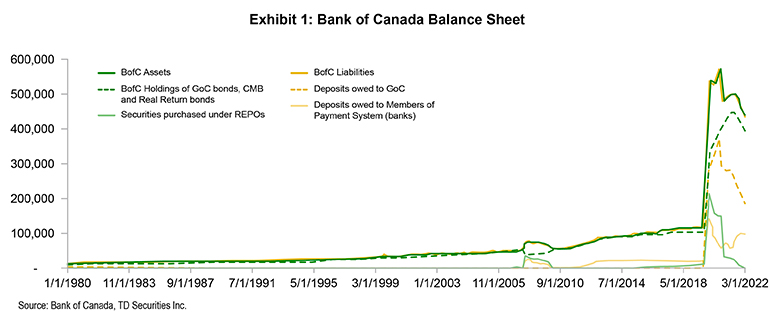
We view the REPOs (repurchase agreements) as a quick shot of adrenalin to the system, and the significant bond holdings as the "real" quantitative easing (QE).

Consider what central bank liabilities decline as the BofC and the Federal Reserve commence shrinking the asset side of the balance sheet by not reinvesting as bonds mature or actively selling. A review of the liability side of the BofC balance sheet reveals that deposits with the BofC (liabilities of the BofC) increased materially during QE, with the recipients of the significant liquidity being the Government of Canada (GofC), but more so, Canada's commercial banks

The impact of pandemic QE on bank assets

Comparing domestic bank assets to the BofC balance sheet up to 2010, QE does not increase the commercial banks' balance sheets because it is essentially a swap of bank assets for treasuries or other forms of liquid assets. Note the significant increase in BofC assets in 2008 (and subsequent decline) with little or no impact on the commercial banks.
Two lines graphs of Quantitative Easing where effect on bank balance sheets only appeared in after 2020
Now we have a look at pandemic QE, and we see a significant difference. The sharp increase in BofC assets matches up nicely with the increase in commercial bank assets. What we suggest is that pandemic QE appears to have had a material impact on commercial bank balance sheets, while 2008 QE did not.

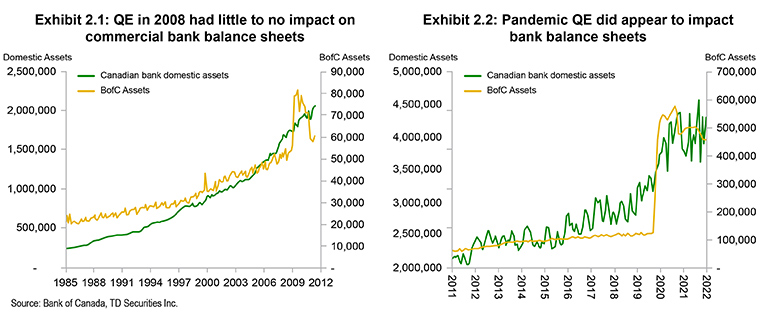
Why was the effect of the Pandemic's QE different?

Pandemic QE resulted in greater BofC deposits (liquid assets of the commercial banks) and greater deposits in the commercial banking system (liabilities of the commercial banks). We estimate that if domestic deposits at Canada's commercial banks had continued to grow at the historical rate, deposits today would be $2.5 trillion, approximately $115bn lower than they are.

We contend that QE in 2020 was different from QE in 2008 in that the central banks purchased assets outside the commercial banks.

What have we learned so far?

  • In QE, central banks, through purchases of securities from commercial banks, increase reserves at the banks – creating more liquidity.
  • In pandemic QE, central banks purchased securities outside the banking sector which created deposits within the banking sector. The banks are sitting on significantly more assets and deposits in Canada and the U.S. than they were before the pandemic.

What happened next?

The banks were flush with liquidity, but loan demand was weak – at first.

How did QT increase liquidity ratios?

The Liquidity Coverage Ratio (LCR) is a daily calculation of the ratio of High-Quality Liquid Assets (HQLA) held by a bank to the total net stressed cash outflows over the next 30 calendar days. HQLA consists of holdings of cash, highly rated debt issued or backed by governments, highly rated covered bonds, nonfinancial corporate debt, and non-financial equities that are part of a major stock index.

Shortly after the pandemic commenced, QE drove deposits materially higher, the proceeds of which were invested in HQLA (high quality liquid assets) and other liquid assets, driving the LCR (Liquidity Coverage Ratio) much higher. Note that the LCR is a consolidated measure. That is, the capital ratios (discussed above) and liquidity ratios include the U.S. and other non-Canadian operations of Canada's banks.
Line graph of loans where deposits grew much faster than loans at first following the start of the pandemic.

The banks are in a sweet spot – Higher margins earned on bloated balance sheets

Deposits gathered outside Canada cannot be used to fund loans in Canada – deposits are not fungible across borders. As such, excess deposits in the U.S. (the U.S. condition) cannot fund excess loans in Canada (the Canadian condition). Our consolidated analysis points to materially greater excess deposits in the U.S. operations of the Canadian banks. This is relevant to the discussion because U.S. depositors have generally been faster to move money into higher yielding investments (money market funds) than Canadian depositors.

When we say the banks are in a sweet spot, what we mean is margins are climbing, while balance sheets remain bloated driving unusually strong Net Interest Income (NII). But nothing lasts forever. What caused the balance sheets to become bloated in the first place, could well shrink bank balance sheets going forward. To be very clear, this has already commenced in the U.S. – declining deposit balances and higher deposit betas.

If we do in fact see average earning assets flatline over the next few years, capital allocation – buybacks, U.S. deals, and acquisitions more generally, would play an outsized role in how investors look at the individual banks.

Subscribing clients can read the full report on the TD Securities Market Alpha Portal


Headshot of Mario Mendonca


Managing Director and Senior Financial Services Analyst, TD Securities

Headshot of Mario Mendonca


Managing Director and Senior Financial Services Analyst, TD Securities

Headshot of Mario Mendonca


Managing Director and Senior Financial Services Analyst, TD Securities

back to top